Measuring Fitness

How to measure fitness?
Every year the CrossFit Games aims to crown the fittest man, woman, and team on the planet. Prize money totals over $1,000,000 and only continues to increase. The problem is that this business of fitness is bias. It does not crown the truly fittest. It crowns those who can best play the game. Thus, the CrossFit Games is a sport, not a test. If it were a test how should we test for the fittest?
Fitness Metric
A typical leaderboard for a fitness competition, such as the CrossFit Games, looks something like this.
| Athlete | Event-1 | Event-2 | Event-3 |
|---|---|---|---|
| Athlete1 | 1 | 3 | 2 |
| Athlete2 | 3 | 1 | 3 |
| Athlete3 | 2 | 2 | 1 |
CrossFit’s current system replaces rank with points. A simple leaderboard looks like this.
| Athlete | Event-1 | Event-2 | Event-3 |
|---|---|---|---|
| Athlete1 | 100 | 50 | 75 |
| Athlete2 | 50 | 100 | 50 |
| Athlete3 | 75 | 75 | 100 |
I suggest we remove the points system if we truly wish to test for fitness. One direct application if when we can relate health to fitness. In this case it is necessary to directly test for fitness. But this is for another post.
Here we convert ranks to euclidian distance with average rank and rank standard deviation.
| Athlete | Event-1 | Event-2 | Event-3 | Avg | Std |
|---|---|---|---|---|---|
| Athlete1 | 1 | 3 | 2 | 2.0 | 0.82 |
| Athlete2 | 3 | 1 | 3 | 2.3 | 0.94 |
| Athlete3 | 2 | 2 | 1 | 1.7 | 0.47 |
Now we compare to a ideal fitness, which is ranking first in every event. The average rank would be 1 and the standard deviation 0. We calculate distance from this ideal point. For reference, we also add the ideal least fit athlete.
| Athlete | Event-1 | Event-2 | Event-3 | Avg | Std | Fitness |
|---|---|---|---|---|---|---|
| Fittest | 1 | 1 | 1 | 1 | 0 | 0 |
| Athlete1 | 2 | 4 | 4 | 3.3 | 0.94 | 2.5 |
| Athlete2 | 3 | 3 | 2 | 2.7 | 0.47 | 1.7 |
| Athlete3 | 4 | 2 | 3 | 3 | 0.82 | 2.2 |
| Unfittest | 5 | 5 | 5 | 5 | 0 | 4 |
Here we plot the results from our example.
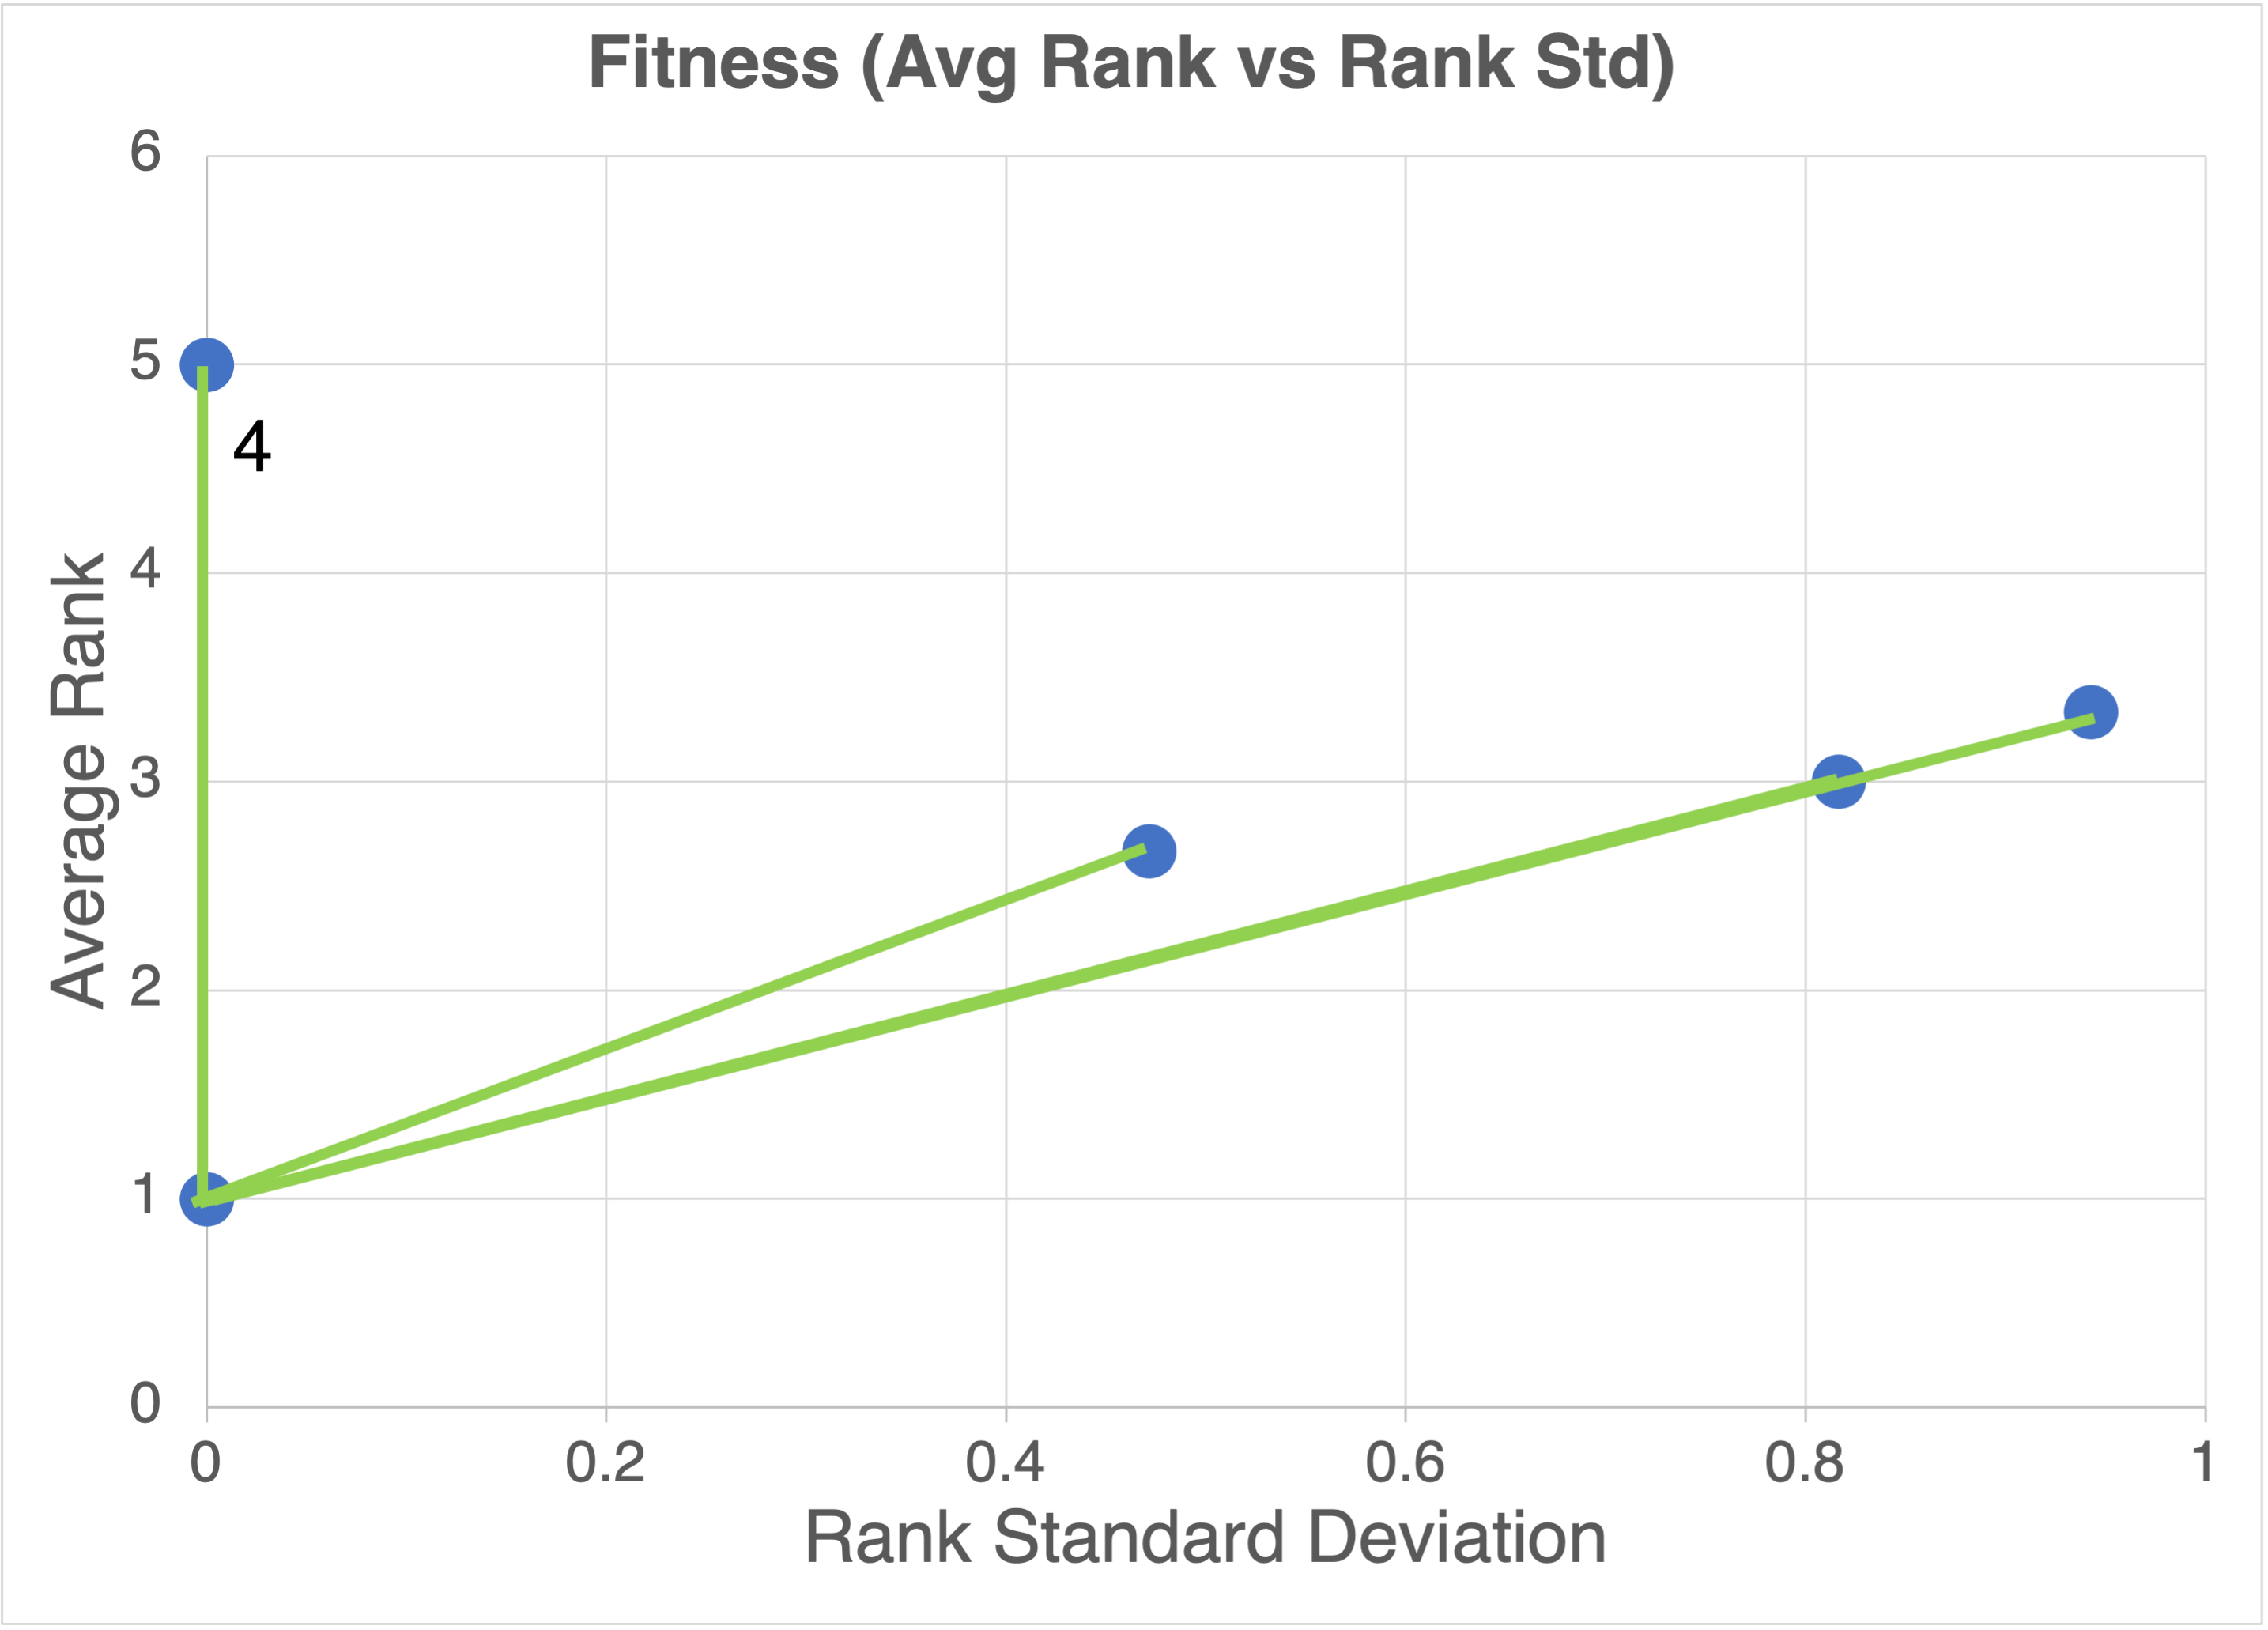 Example fitness plot. Blue dots are the {rank standard deviation, average rank}. Green lines are the fitness (euclidian distance to ideal). Black number is the fitness value.
How does this change CrossFit Games results?
The CrossFit Games - 2013
Here I have plotted the final 2013 CrossFit Games results for the individual male division. For reference the top five using the point system is
- Rich Froning
- Jason Khalipa
- Ben Smith
- Scott Panchik
- Garret Fisher
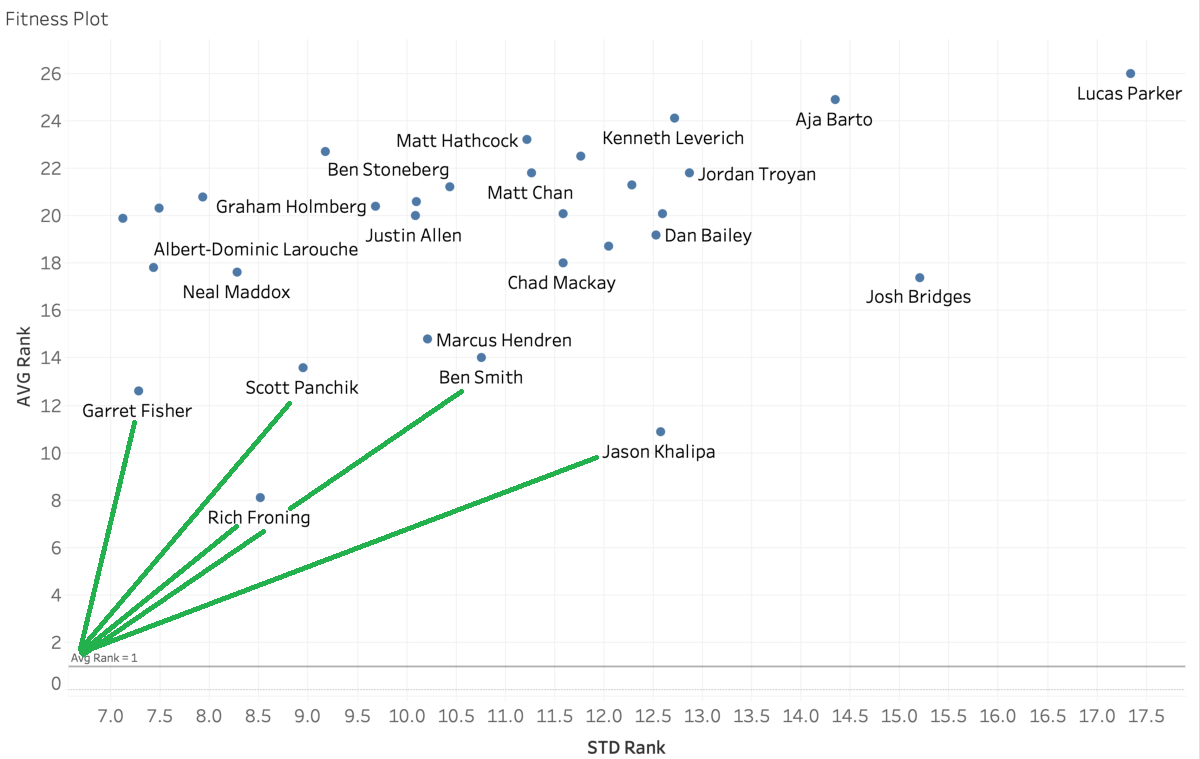 The 2013 CrossFit Games plotted with the fitness metric.
The new fitness metric shows the top five as
- Rich Froning
- Garret Fisher
- Scott Panchik
- Jason Khalipa
- Ben Smith
The main take away is that the top five is the same. However, the bragging rights and prize money present drastic differences.
1st - $275,000
2nd - $75,000
3rd - $45,000
4th - $20,000
5th - $18,000